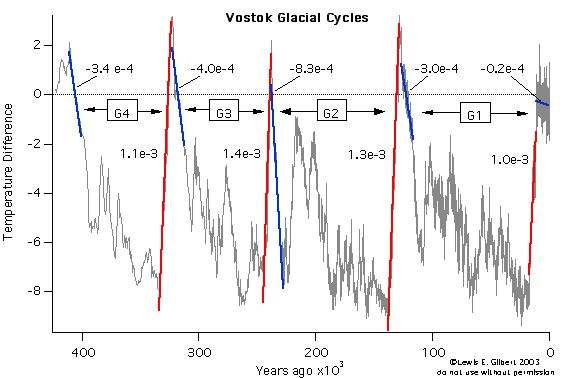
The figure above shows a record of the temperature of the atmosphere in Antarctica over the last 400K years. These temperatures are calculated from measurements of the concentrations of certain gasses that become trapped in small bubbles in the ice as it is compacted. The measure of temperature is not absolute; it is a difference from some reference period. In this case the reference is the average temperature over a number of recent decades. Note that time is indicated in years before present.
In the figure there are 4 glacial cycles labeled G1 through G4. Each of those cycles is about 100K years long. G1 the most recent glacial cycle ended about 10,000 years ago. Each of the four complete cycles starts with a fairly rapid decrease in temperature to temperatures that are 2 - 8 degrees Celsius colder than today. The cold periods are glacial periods. One thing that is striking is that while the temperature remains "cold" during a glacial period, there are fairly large variations. Each of the glacial cycles ends very abruptly with a large increase in temperature from fairly cold to levels that are perhaps a couple of degrees warmer than today.
In each of the cycle there is a blue line and a red line. The blue line represents the average rate of temperature decrease for the 10K years following the peak temperature. Each blue line is labeled with a negative number that gives the rate of temperature decrease in degrees per year. The red line in each cycle is the average rate of temperature increase for the abrupt ending of the cycle. The red lines are labeled with positive numbers that give the rate of temperature increase in degrees per year.
Aside
Remember that the "e" indicates scientific notation thus 1e-3 is 0.003.
End
Note that each of the cycles G1-G4 ends with temperature increase rates that are very similar - roughly 1.1e-3 degrees per year. While not quite as similar, the rates of temperature decrease that signal the beginning of each the cycles is about the same; G1, G3, and G4 begin with rates of temperature decrease of about 3.5e-4. G2 begins with temperatures falling at about twice that rate. The changes in temperature that mark the end of a cycle are more than 10 times as rapid as those that start the period. So cycles G1-G4 have very similar temperature histories. They start with rapid cooling of (roughly the same rate), they show oscillations during the glacial period which lasts about 100K years and they end with very rapid increases in temperature.
The short blue line at the very right of the figure represents the average temperature change over the time since the end of the last full glacial cycle. That average shows that temperature has been decreasing, but at a very slow rate compared to the previous cycles (about 10 time slower). Agriculture was invented at the very beginning of this period of relatively stable, and warm, temperatures; and all of the subsequent major developments in human history have occurred in times of historically stable temperatures.
The main point in this figure is that compared to the last 400K years, the recent 10K years are anomalous. If the pattern of the cycles G1 - G4 had repeated again, we would now have temperatures that would be much colder than than we now have.
Aside
Exercise for the reader What have I glossed over in the preceding?
End


