The theme of this blog is Earth systems management. The idea is to explore my ideas about what we know and what we need to learn about how our planet works. Building on that I want to begin to sketch out thoughts on how we might begin to organize ourselves in order to maximize the chance that human activities will be as benign as possible with respect to the health of our planet and the chance that generations to come will enjoy a good quality of life.
Tonight I am going to recap a bit on what I have written so far. Partly this is because my imagination is a bit dull and partly to help think about where to go next (are the two related?).
I have spent a fair amount of time on epistemological issues like modeling and rationality. The reason I have been working on these issues is that I want to establish a foundation for how we (scientists anyway) think about problems. While this is part of decision-making, it is very different from the kinds of things that decision scientists think about (e.g. I haven't talked at all (with the possible exception of the little bit on bounded rationality) about individual cognitive and psychological issues).
I have skirted around issues of complexity, but still haven't gotten to hierarchy or emergent phenomena. It is because I expect that to a certain extent global decisions will be emergent, that I am not so interested in individual cognitive processes. (This reflects some of my ideas with respect to scale; I am willing to accept individual brains/ minds as black boxes in the context of Earth systems management. (Note that this does not mean I thnk minds / brains are uninteresting in other contexts.))
I have talked about weather and climate (although I haven't done anything about it). Climate is the natural Earth systems that I know the most about and am most interested in, but it is not the only one. Biodiversity is another major Earth systems topic. Issues of ecosystems link biodiversity and climate and are also interesting in their own right.
I have written some about public policy and perhaps hinted at some political theory.
Some of the things that need to be reviewed in upcoming entries include:
- global institutions
- the Intergovernmental Panel on Climate Prediction
- the many facets of globalization
- more on political theory
- some entries on important systems and cycle (e.g. carbon cycle, food webs, ecosystem services)
- and much much more...
Stay tuned.
June 24, 2003
June 23, 2003
Stormy Weather
A nice little blurb in the times today gives a feel for how meteorologists think about the weather in statistical frames.
June weather in New York City is explainable by the location and shape of the jet stream, but no explanation for the shape of the jet stream is offered. It is noted that wet junes tend to be followed by dry augusts (italics added). The tendency is a statistical observation. It does not need any process explanation associated with it, it is simply something that people who follow weather statistics closely have noted.
The absence of a process explanation is a source of debate among scientists. On the one hand there is the more empirical group who for patterns in weather data and then develop methods for making statments about how robust those patterns are. On the other hand there is the more theoretical group who base their science in the physics of the atmosphere (and ocean); this group develops models based in fundamental physics and roots their understanding in the underlying causal mechanisms. Ideally these two groups will get to the same answers, but their methods are fundamentally different and they don't always see eye-to-eye.
Myself, if called to comment, I would probably agree that it has been a bit wet this June, but the truth be told I haven't minded much. And if really pushed I might ask how the average rainfall has changed over the last decade or so. Is it possible that the average hasn't changed much but the variance is getting larger?...
June 20, 2003
Temperature Changes - Part 2
The last post in this series focused on the roughly 100,000 year time scale of the glacial cycle. In this post I am going to zoom down 2 orders of magnitude to focus on the last roughly 1000 years.
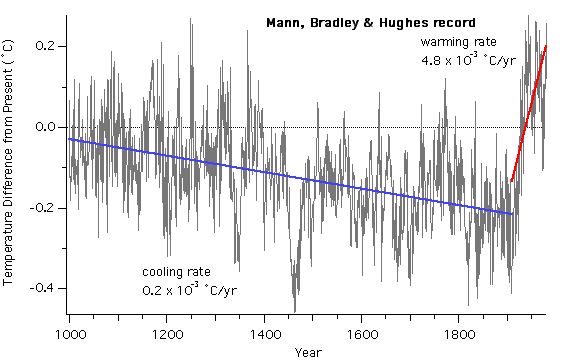
The figure above shows data that reconstructs the temperature history of Earth over the last 1000 years. As with the Vostok record, the temperatures are represented as differences from some reference period. The data in this figure come primarily from tree ring records. In the case of tree rings, growth rates can be correlated with temperature and the rings provide a time marker. Some of the more recent portions of this record are based include instrumental measurements and other record that were kept in monasteries and similar long-lived institutions.
This record above is sometimes referred to as the hockey stick record. This refers to the fact that the trend of the temperature changes abruptly from cooling to warming sometime around 1900. The cooling indicated by the blue line shows a cooling rate that is comparable to the cooling rates that are typical of the beginning of previous glacial periods. The warming indicated by the red line shows a rate that is about 3 times faster than the warming rates the commonly ended a glacial period.
As in the glacial record, the most recent portion of this record is anomalous. The cooling of the first part of the last millennia is consistent with the beginning of another glacial period and indeed in the 1970's many scientist thought that we should be entering a new glacial period. That cooling ends very abruptly with a rate that is very fast compared to those at the ends of the previous glacial episodes. (I will return to this rate in a later post in this series.)
A close look at the figure above suggests that this rapid rate may have slowed recently. The following figure shows that while there is some variation, the temperature continues to warm.
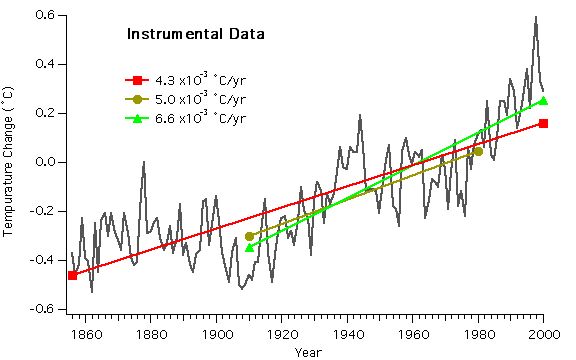
The trend lines indicate the variation that can come with the choice of the window over which the average is calculated. The fastest rate starts after the period of roughly constant temperature in the late 19th century and ends at the end of the record in 2000. The slowest rate is that calculated over the entire record. That rate is consistent with the rate shown the in first figure.
The point here is that whatever the cause of the recent warming, its rate is very high compared to those warmings that marked the end of the last 4 glacial periods. It also reflects an abrupt change from the cooling of the previous 900 years. We may quibble whether this variation is natural or human induced, but whatever the cause, it is clearly anomalous with respect to glacial cycles, with respect to the last 10,000 years and with respect to the last 900 years.
The figure above shows data that reconstructs the temperature history of Earth over the last 1000 years. As with the Vostok record, the temperatures are represented as differences from some reference period. The data in this figure come primarily from tree ring records. In the case of tree rings, growth rates can be correlated with temperature and the rings provide a time marker. Some of the more recent portions of this record are based include instrumental measurements and other record that were kept in monasteries and similar long-lived institutions.
This record above is sometimes referred to as the hockey stick record. This refers to the fact that the trend of the temperature changes abruptly from cooling to warming sometime around 1900. The cooling indicated by the blue line shows a cooling rate that is comparable to the cooling rates that are typical of the beginning of previous glacial periods. The warming indicated by the red line shows a rate that is about 3 times faster than the warming rates the commonly ended a glacial period.
As in the glacial record, the most recent portion of this record is anomalous. The cooling of the first part of the last millennia is consistent with the beginning of another glacial period and indeed in the 1970's many scientist thought that we should be entering a new glacial period. That cooling ends very abruptly with a rate that is very fast compared to those at the ends of the previous glacial episodes. (I will return to this rate in a later post in this series.)
A close look at the figure above suggests that this rapid rate may have slowed recently. The following figure shows that while there is some variation, the temperature continues to warm.
The trend lines indicate the variation that can come with the choice of the window over which the average is calculated. The fastest rate starts after the period of roughly constant temperature in the late 19th century and ends at the end of the record in 2000. The slowest rate is that calculated over the entire record. That rate is consistent with the rate shown the in first figure.
The point here is that whatever the cause of the recent warming, its rate is very high compared to those warmings that marked the end of the last 4 glacial periods. It also reflects an abrupt change from the cooling of the previous 900 years. We may quibble whether this variation is natural or human induced, but whatever the cause, it is clearly anomalous with respect to glacial cycles, with respect to the last 10,000 years and with respect to the last 900 years.
June 19, 2003
Bush Climate Science
Andrew Revkin and Katherine Seelye had a disturbing piece in the Times today. In that article they report that the editing of an upcoming EPA report on the state of our environment has been heavily influenced by the White House. A major section on the likely impacts of climate change has been essentially removed. Ironically, among the bits that have been chopped out are references to a National Research Committee report that the Bush Administration itself commissioned.
Rather than a "summary statement about the potential impact of changes on human health and the environment", the report's section on Global Issues begins with a statement about how complex and tricky the issues are. While the statement is true, it distracts from the issue that we have no choice but to deal as best we can with that complexity. The failure to address the global environment and in particular the climate is explained by Bush appointees as avoiding a rush to judgment. When this is challenged they respond by saying essentially "please be patient, our comprehensive plan for addressing global climate change will be ready soon."
A little more than a year ago, Bush presented his new way of thinking about greenhouse gas emissions by introducing the concept of greenhouse gas intensity. While clever many authors have shown the slight of hand of this rhetoric, my own contributions are a short white paper and a video.
Aside
Yesterday I lectured my environmental policy class on Kingdon's notions of governmental and decision agendas. We talked about whether the environment is on the Bush agenda and I argued that it is rhetorically present, but not really occupying any one's time. Now I am not so sure. It seems to me that it is occupying time but in the negative sense; the Bush administration seems to be actively avoiding taking action.
End
There are a host of simple observations that even many of the skeptics can agree on that indicate that our planet's physical and biological systems are not functioning as that once did (e.g. my post of a few days ago on the Vostok core, or any host of observations about the distribution of mountain glaciers or plant life). Yet in a frightening petard hoisting, inevitable scientific uncertainty is being used to avoid addressing changes in the Earth system a responsible way.
We have become distracted in our quest to determine whether or not or how much of a change in a system is due to human activity as opposed to natural variability. In many ways it does not matter. We are vulnerable to changes in the climate independent of any assessment of blame. While it is true that changes in our fossil fuel consuming habits will take many decades to manifest themselves as mitigative forces in the climate system, there are other kinds of activities we could be undertaking that will have shorter term benefits.
What really frighten's me about political staff becoming involved in the editing of scientific documents is not the cynicism but the hubris. I hated Greek tragedy when I was forced to read it, but the pattern was always there.
June 17, 2003
Carbon Trading
Most of the people I talk to think that we will trade carbon. It is just a matter of when. I think that I agree with them.
I also get general agreement when I say that I think that it is likely that leadership in the development of carbon trading will come from the private sector. This is actually an interesting development. Most of the thinking about carbon trading is based on an analogy with the trading of sulfur permits in the US. Sulfur trading is part of the framework that was put in place to address issues associated with acid rain. In that framework the US government sets a total amount of sulfur that can be emitted into the atmosphere and sells rights to emit that much material. The price of the right to emit a unit of sulfur is then set by market mechanisms.
There are two ways for a company (say an electric utility) to manage the sulfur that it produces as atmospheric waste. First it can modify it practices so that there is less atmospheric sulfur waste. Modification might include switching to lower sulfur coal or developing new combustion technologies that trap sulfur before goes up the stack. Second it can buy permits to allow the needed sulfur emissions. In a market system, companies will choose which ever option is cheaper. Because the total amount of sulfur that can be emitted is limited and declining, there is incentive to develop new processes in order to avoid having to buy increasingly scarce permits.
Sulfur trading has been fairly successful. The total amount emitted has steadily decreased and, surprisingly, so has the price of permits. Prices have dropped because, the process changes that were encouraged by the structure of the framework have been very successful.
Aside
The story is a little more complicated because at the same time as sulfur permits were being implemented, railroads were being deregulated. Railroad deregulation had the effect of lowering the price of lower sulfur coal from the western states.
End
The sulfur system is called a "Cap and Trade" framework. The total amount of sulfur emissions is "capped" and companies then trade to account for differences in their needs and capacities. The price is initially set by the imposition of the Federal government of the cap. At the implementation point of the system an initial set of property rights is established. Setting the initial level and the initial distribution of property rights is a tricky political problem, but one that was solved in the case of sulfur.
Carbon is different from sulfur. In the case of sulfur and acid rain, the problem could be usefully addressed within the confines of a single nation-state; although there are interesting conflicts with Canada. The time and space scales of the sulfur problem are such that costs and benefits could be assessed and results could be seen in manageable time frames. None of these is true for carbon. Carbon mixes fairly quickly on a global scale and has a time scale in the atmosphere of centuries; thus no single nation can unilaterally address the problem and the benefits may take decades to accrue. Furthermore the details of the carbon cycle are much more complex than those of acid rain.
In some ways the Kyoto Protocol can be thought of as a cap and trade system. It attempts to put limits on the total amount of carbon that can be emitted into the atmosphere and it attempts to allocate initial property rights to those emissions. In this way the Kyoto Protocol would establish a framework in which the value of a ton of carbon could be established.
In a classical sense, some form of capping is necessary to establish a market for carbon, but it doesn't look like people are waiting for that to happen. The price of a ton of carbon is currently somewhere between $3 and $30. Some people I have talked to say the range is much smaller than that. It appears that a growing number of forward thinking companies expect that carbon will be managed in some way in the future. Those companies believe that first movers with respect to the capacity to trade and manage their carbon will have competitive advantage when that day comes. There are enough of those companies that there is a group associated with the Chicago Board of Trade that has established the Chicago Climate Exchange to handle the expected market in carbon trading. There are also large companies such as BP and DuPont that trade carbon internally.
Thus the capacity to trade is being developed in the absence of a regulatory framework. That capacity reflects the expectation by large, globally distributed, firms and groups of firms that carbon emissions are a liability that needs to be hedged. I expect this to continue to develop and that those who are hedging now will come out ahead of the game.
June 16, 2003
El Nino and Love Canal
One spring day in 1977, Karen Schroeder saw from her window that the liner in the fiberglass swimming pool in her backyard had risen two feet above the ground as a consequence of the year's heavy precipitation. When the pool was removed that summer, the hole it left filled with water laden chemicals...
from A Hazardous Inquiry: the rashamon effect at Love Canal Allan Mazur, 1998
This was part of the beginning of the events that lead eventually to the evacuations of many residents around the infamous Love Canal chemical dump near Niagara Falls, New York.
Between 1941 and 1954, the Hooker Electrochemical Company dumped 25,000 pounds of chemical waste in an abandoned canal. These wastes were both solid and liquid; some, but not all, were contained in 55 gallon drums. Many of the waste products were benzene variants. There was also 120 lbs of dioxin.
Hooker knew that the materials they were dumping were toxic, but their was little understanding of the effects on humans. In reviewing the activities of Hooker in the legal aftermath of the evacuations, it became clear that the chemical company had, at the very least, conducted its waste dumping activities at the level of best practice for that period.
The canal that Hooker used was dug in the 1890s to tap into the power of the flowing water in the Niagara river. It was about 1/2 miles long, 8-16 feet deep and 60-80 feet wide. The lower parts of the canal were in clay which is fairly impermeable; above the clay, the material was fairly permeable. Hooker buried their wastes as they went, but the company-specified 4 feet of cover was not always maintained.
At the time they began dumping the canal was right at the edges of the westward expansion of development around Buffalo, NY. Hooker was concerned about its liability. When the property was transferred to the Board of Education, the deed explicitly acknowledged that chemicals were buried at the site and it seemed to be understood that excavation at the site would increase the likelihood of mobilizing the material that was buried there. In the 1960s and 1970s the area around the dump developed into working- and lower-class neighborhoods. Part of this development was the construction of a school and playgrounds on the dump site, building of houses that abutted the site and the installation of sewers and other infrastructure that, in fact, did involve excavations that compromised the integrity of the dump.
So where do floating swimming pools and El Nino come in?
1976 and 1977 were El Nino years and it rained a lot in upstate New York. That rained filled up the canal and floated Karen Schroeder's pool. As the canal filled up, it brought a lot of the stuff that had been buried there with it. Now the stuff had been there all along and there had been El Nino's since the building of the dump, but the extent of the rains was record setting and the neighborhoods had reached the point the Karen Schroeder had a pool along side the canal.
The disaster at Love Canal was going to happen; the heavy rains may have hastened the inevitable. The industrial and health standards of the 40s and 50s reflected the "infinite sinks" notion of waste management and the infancy the field of toxicology. The planning and early management of the site did not foresee the continued suburban development that would eventually surround the site. The waste management and toxicological naivete can be understood; the failure to project the suburban development, I think, is more difficult to explain.
The question in my mind is "what are the modern day analogs to the best practices that Hooker was using?"
June 13, 2003
Small, cheap, motorized scooters
In my neighborhood there is a bit of a summer fad going on that involves young men (mostly) zooming about on inexpensive (~$400) motorized scooters. I would trace the evolution of these scooters back to the foot powered ones that kids zoom about on (the progression involved putting motors on the scooter with the rider standing, followed by the addition of, bigger wheels, seats and fenders).
Beyond curiosity and a bit of middle-age grumbling, an interesting set of thoughts was triggered when I wondered where one would get parts and repair for these things. The answer I came up with is that you probably don't. These machines are cheap enough so that if they last the better part of the summer they are purchased at the beginning of, then they become essentially disposable and rapid dissemination can come in the absence of any infrastructure other than distribution of the machines themselves (e.g. UPS).
The key to this set of ideas seems to be a confluence of inexpensive design and increase in reliability. At point where disposability crosses price in some utility space, the need for a supporting infrastructure beyond distribution and disposal goes away.
The Properties of a Good Consitution
Following The Economist:
A good constituion is short, simple and clear. It avoids attention to detail, but lays out a set of processes for making decisions and for giving attention to detail. The processes it lays out can be changed but not easily or without significant deliberations. A good constitution sets out the goals of the organization it guides and the means for achiveing those goals.
A constitution should avoit detail because it is likely to get much of it wrong. Constituions need to have long time scales in order to engender confidence that the governing framework is stable. Thus the details need to be handled at a "lower" level. It is a mistake to allow decision-making scales to become strongly linked. That is, details must be able to be adjusted as learning occurs without changing the constituion.
June 12, 2003
Bounded Rationality
A classical conceptualization of decision making is the following:
This is a rational frame, but it relys on / assumes complete information and large computational capacity. In all but the simplest cases, the completeness of this scheme makes it unimplementable.
In place of this optimizing scheme, James March and Herbert Simon suggest that a better model is the following:
In this frame actions do not have complete information and different actors have different (and not necessarily consistent) information. Achieving a satifactory state can be accopmplished in two ways. First the activities and decisions that are undertaken can advance the system to a new and satisfactory state. Second, if progress toward a satisfactory conditions is too difficult or slow, the standards themselves may be adjusted to accept achievable states as satisfactory.
Innovation can be aded to this program by constraining when statisficing conditions can be changed and including exploratory behaviors in the portfolio of "familiar actions."
Aside
This sounds a lot like genetic algorithms - stand by while I explore that further.
End
Complex behaviors can be achieved without global knowledge at any single points if satificing levels, action programs and problems are parsed (broken into chunks) in the right way. Of course there is no prescription for how to find "the right way" and in a satisficing world, there are likely to be more than one. The details of the "complex behavior" will of course depend on which "right way" is found and operationalized.
- A set of goals is identified
- All possible parhts to the goals are articulated
- The complete portfolio of costs & benefits for all paths is calculated
- The path or paths which maiximizes (optimizes) benefit is chosen
This is a rational frame, but it relys on / assumes complete information and large computational capacity. In all but the simplest cases, the completeness of this scheme makes it unimplementable.
In place of this optimizing scheme, James March and Herbert Simon suggest that a better model is the following:
- Rather than optimal goals, satifactory conditions are set.
- Familiar modes of action are tried first, without global cost / benefit analysis
- To the extent that costs and benefits are considered, they are evaluated relative to local conditions using local knowledge
- When a satisfactory state is achieved, action stops; there is no attempt to maximize utility, only to attains some acceptable level.
In this frame actions do not have complete information and different actors have different (and not necessarily consistent) information. Achieving a satifactory state can be accopmplished in two ways. First the activities and decisions that are undertaken can advance the system to a new and satisfactory state. Second, if progress toward a satisfactory conditions is too difficult or slow, the standards themselves may be adjusted to accept achievable states as satisfactory.
Innovation can be aded to this program by constraining when statisficing conditions can be changed and including exploratory behaviors in the portfolio of "familiar actions."
Aside
This sounds a lot like genetic algorithms - stand by while I explore that further.
End
Complex behaviors can be achieved without global knowledge at any single points if satificing levels, action programs and problems are parsed (broken into chunks) in the right way. Of course there is no prescription for how to find "the right way" and in a satisficing world, there are likely to be more than one. The details of the "complex behavior" will of course depend on which "right way" is found and operationalized.
June 11, 2003
Temperature Changes - part 1
This is the first installment of a series of posts where I plan to discuss the current state of the climate system. In these posts I will use publicly available data and make simple observations about this temperature history of our planet. In this installment I am going to look at the glacial cycles of the past 400,000 (400K) years.
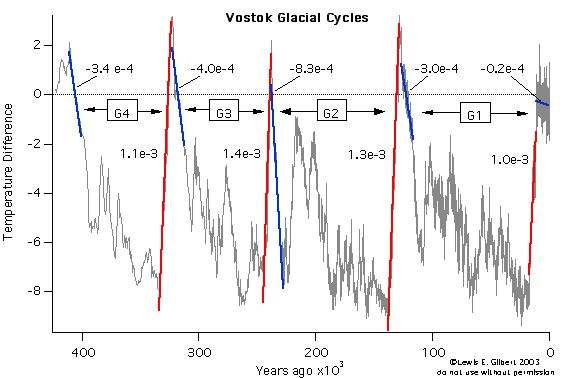
The figure above shows a record of the temperature of the atmosphere in Antarctica over the last 400K years. These temperatures are calculated from measurements of the concentrations of certain gasses that become trapped in small bubbles in the ice as it is compacted. The measure of temperature is not absolute; it is a difference from some reference period. In this case the reference is the average temperature over a number of recent decades. Note that time is indicated in years before present.
In the figure there are 4 glacial cycles labeled G1 through G4. Each of those cycles is about 100K years long. G1 the most recent glacial cycle ended about 10,000 years ago. Each of the four complete cycles starts with a fairly rapid decrease in temperature to temperatures that are 2 - 8 degrees Celsius colder than today. The cold periods are glacial periods. One thing that is striking is that while the temperature remains "cold" during a glacial period, there are fairly large variations. Each of the glacial cycles ends very abruptly with a large increase in temperature from fairly cold to levels that are perhaps a couple of degrees warmer than today.
In each of the cycle there is a blue line and a red line. The blue line represents the average rate of temperature decrease for the 10K years following the peak temperature. Each blue line is labeled with a negative number that gives the rate of temperature decrease in degrees per year. The red line in each cycle is the average rate of temperature increase for the abrupt ending of the cycle. The red lines are labeled with positive numbers that give the rate of temperature increase in degrees per year.
Aside
Remember that the "e" indicates scientific notation thus 1e-3 is 0.003.
End
Note that each of the cycles G1-G4 ends with temperature increase rates that are very similar - roughly 1.1e-3 degrees per year. While not quite as similar, the rates of temperature decrease that signal the beginning of each the cycles is about the same; G1, G3, and G4 begin with rates of temperature decrease of about 3.5e-4. G2 begins with temperatures falling at about twice that rate. The changes in temperature that mark the end of a cycle are more than 10 times as rapid as those that start the period. So cycles G1-G4 have very similar temperature histories. They start with rapid cooling of (roughly the same rate), they show oscillations during the glacial period which lasts about 100K years and they end with very rapid increases in temperature.
The short blue line at the very right of the figure represents the average temperature change over the time since the end of the last full glacial cycle. That average shows that temperature has been decreasing, but at a very slow rate compared to the previous cycles (about 10 time slower). Agriculture was invented at the very beginning of this period of relatively stable, and warm, temperatures; and all of the subsequent major developments in human history have occurred in times of historically stable temperatures.
The main point in this figure is that compared to the last 400K years, the recent 10K years are anomalous. If the pattern of the cycles G1 - G4 had repeated again, we would now have temperatures that would be much colder than than we now have.
Aside
Exercise for the reader What have I glossed over in the preceding?
End
June 09, 2003
Monkey Pox
A number of Midwestern states have reported cases of monkey pox. Apparently these are the first cases of this disease to be reported in the western hemisphere. Fortunately, while monkey pox symptoms are similar to small pox, it is not as virulent and mortality in generally healthy populations is likely to be low.
I have written some on SARS and how it appears that that virus may have jumped from domestic animals to humans. The same appears to be true of monkey pox, but rather than pigs and chickens, the animals are Gambian rats and prairie dogs. The path appears to be from Gambian rat to prairie dog to human. Monkey pox makes the prairie dogs sick and can be fatal to those animals As reported by the AP it may be that most of the cases in the midwest can be traced back to a single exotic pet distributor in Chicago. That shop has been quarantined and many of its prairie dogs have been killed.
This brings to mind a number of thoughts. The first of which is "What in world are people thinking with respect to pets!?" Now I may be a bit curmudgeonly on this front, but I don't think that I am out of line thinking that it doesn't make a lot of sense to bring large African and Texan rodents together in close quarters and then to add a large primate to the mix.
Aside
Joel Cohen and his collegues figured out that huge decreases in Chagas disease could be achieved by having the livestock live outside and the humans live inside. While this seems obvious in the case of the rural Andes, it does not seem to be applied to suburban Chicago.
End
Two other things that come to mind are: 1) the seeming prevalence of disease that jumps from animals to humans; and 2) the global mixing of species. Quick surveys of the web suggest that monkey pox, here-to-fore, has been confined to central Africa. Now it has jumped directly to the metropolitan Midwest. There seems to be no question that the disease was transported by exotic pet traders from Africa to the US. I don't know whether to be amazed that our livestock controls have worked so well for so long or to be horrified at the thought of the geographically artificial inter-species mixing that is going on.
It is likely that this little outbreak will be controlled (provided people don't start turning their sick prairie dogs out into the wild where they can / will infect healthy indigenous populations). And it is in many ways a simple and relatively benign case of human foible and ecentricity. It does, none-the-less, illustrate the kind of thing that we need to manage as we go forward. In this case there are many regulations that control the flow of animals across borders and across ecological niches. That regulatory framework may need to be shored up, but it is one way to approach the problem.
But what happens when something slips through the regulatory net, as appears to have happened with monkey pox; or when the regulatory net is non-existent or inadequate as would be the case with SARS in Guang Dong? When that happens we need another set of mechanisms that are highly dynamic and that can react to a rapidly changing state of affairs. With disease it looks like the strategy is to isolate the disease and then eliminate it; this is the strategy behind quarantine. If a disease gets established in wild populations (as may be the case with SARS and is the fear regarding sick prairie dogs going into the wild) then isolation and eradication will not work and the strategy has to be one of controlling and limiting outbreaks. If we are lucky vaccines can be developed and human morbidity minimized.
Earth systems management is going to have to be able to deal with existing and emerging infectious diseases and the fact that these things will be moved around the globe in strange ways as a function of human weirdness.
June 06, 2003
Real Cities
I was in Stockholm for a few days this week and one of the things I thought about was the following: "Why does the US have so few real cities?"
The central city ins Stockholm has only about 600,000 people so it is relatively small. I stayed in Gamla Stan, the "old town" and the hotel I was in trances its roots back to the 17th century, so the city is old. Gamla Stan is also a small island; the city is actually a network of islands.
But what is it that makes a real city? First and foremost, there are alto of people walking around; a functioning mass transit system is probably a corollary to this characteristic. In addition to pedestrians and transit, Stockholm has a well developed bicycle route network and culture.
Aside
The Arland Express, the train to the airport, puts anything we have in NYC to shame. It leaves from the terminals and runs high speed to the city center in 20 minutes. The contrast with the Newark monorail and NJ Transit is stark; two badly marked trains, long wait in a post-industrial landscape and a slow, dingy train to Penn Station (which I admit does qualify as the city center).
End
People live in real cities. Food is easy to find. There is retail at the street level and there are apartments above. There are museums and other cultural institutions. There is night life; that is everyone does not leave at the end of the work-day.
In the US clearly NYC qualifies. Boston probably does. San Francisco, DC and probably Chicago definitely do. LA, Raleigh and Miami don't
So what is my explanation? My guess is that the dominant explanatory variable is age. Real cities developed to a critical mass of people, housing stock and commerce before regular, long distance travel by people became common place; in particular before cars.
Aside
I recognize that cars are a relatively recent development, but so too is explosive population growth.
End
A certain degree of geopgraphic constraint probably helps. Manhattan is an island, as is Gamla Stan and much of the rest of Stockholm. London is a counterfactual. "Transportation hub" and "seat of government" probably also help.
June 01, 2003
Subscribe to:
Posts (Atom)


